Finance Intelligence
Client Context
Our client, a mid-sized professional services firmwith steady salary inflows and modest investments, struggled toanswer two mission-critical questions: arewe saving enough, and are we resilient to financial shocks?
Datawas recorded in spreadsheets — salary records, side-income,expenses, and savings deposits — but without a consolidated view offinancial health.
Their dataset included:
- Salary inflows across 3 years
- Secondary income (freelance/side source)
- Expenses (rent, EMIs, groceries, healthcare, discretionary)
- Savings allocations (mutual funds, fixed deposits, emergency fund)
- Liquid cash balances
The Problem
- Savings Blind Spots — Leadership lacked a clear savings rate % or a view of consistency month-to-month.
- Shock Preparedness — No measure of how long emergency funds could sustain operations (runway in months).
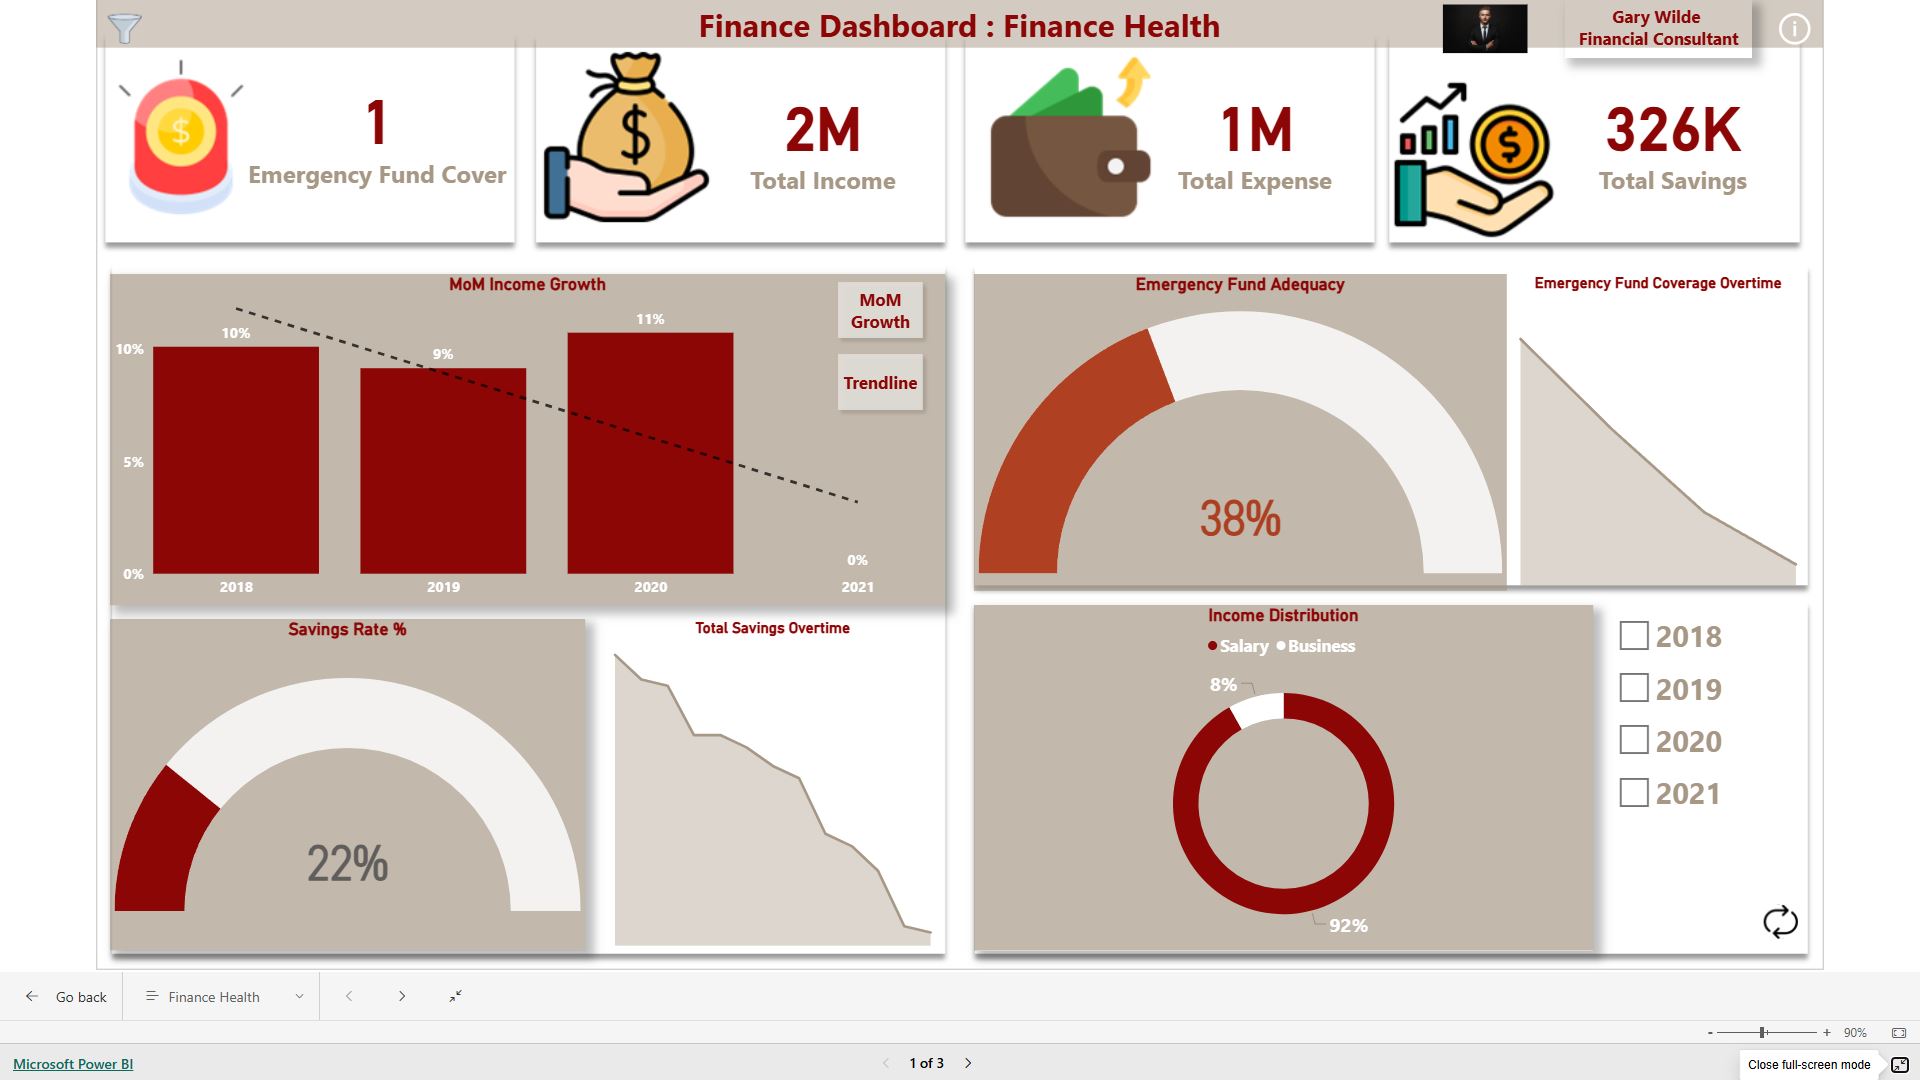
- Income Dependence — Salary made up ~92% of inflows; alternative sources were not visible in contribution terms.
- Manual Bottlenecks — Expense and savings records lived in different tabs; tracking required manual Excel updates.
- Growth Uncertainty — Investments were growing, but there was no visibility into year-on-year net worth progression.
Key Findings
- Emergency Fund Coverage = 0.25 months — reserves covered only ~7 days of expenses, far below the 3–6-month benchmark.
- High Salary Dependence — 92% of total income from salary, exposing risk to job-loss or pay-cut scenarios.
- Expense Composition — Rent + EMIs consumed ~60% of monthly expenses, creating structural rigidity.
- Savings Rate ~22% of income — below recommended thresholds, and inconsistent across months.
- Stress Test Impact — A simulated 20% income drop turned cashflow negative unless savings contributions were paused.
ROPA’s Solution
We designed and deployed a PowerBI Finance Intelligence Dashboard that turned raw records into an executive-ready decision system.
Key features delivered:
- Executive KPI Panel: Total income, savings rate %, expense coverage %, emergency fund runway, and Stress Score (0–100).
- Income & Source Analysis: Salary vs. side-income contribution, trend lines, and diversification index.
- Expense Insights: Fixed vs. variable costs with rent, EMIs, and groceries clearly surfaced.
- Savings & Investment Tracking: Mutual fund growth, fixed deposits, and savings consistency index.
- Runway Calculator: Emergency fund expressed in “months of coverage” with traffic-light thresholds.
- Stress Test Simulator: What-If parameter to model income drops (10–50%) and their impact on cashflow, savings, and runway.
- Traffic-Light Stress Score: Blended coverage + runway into a single score for resilience.
Business Impact & Actionable Steps
Baseline metrics from the initial deploymentwindow (sample):
- Income ≈ $1.5M across 3 years
- Savings ≈ 22% of income
- Expenses ≈ $1.18M with 60% fixed obligations
- Emergency Fund ≈ 0.25 months coverage
- Stress Score ≈ 38/100 (red zone resilience)
Why This Matters
⚡ With this deployment, the client gained asingle source of truthon their financial health. Leadership could seerisks before they became crises,simulate shocks in real time, and track progress toward financialindependence with clarity.