MENU

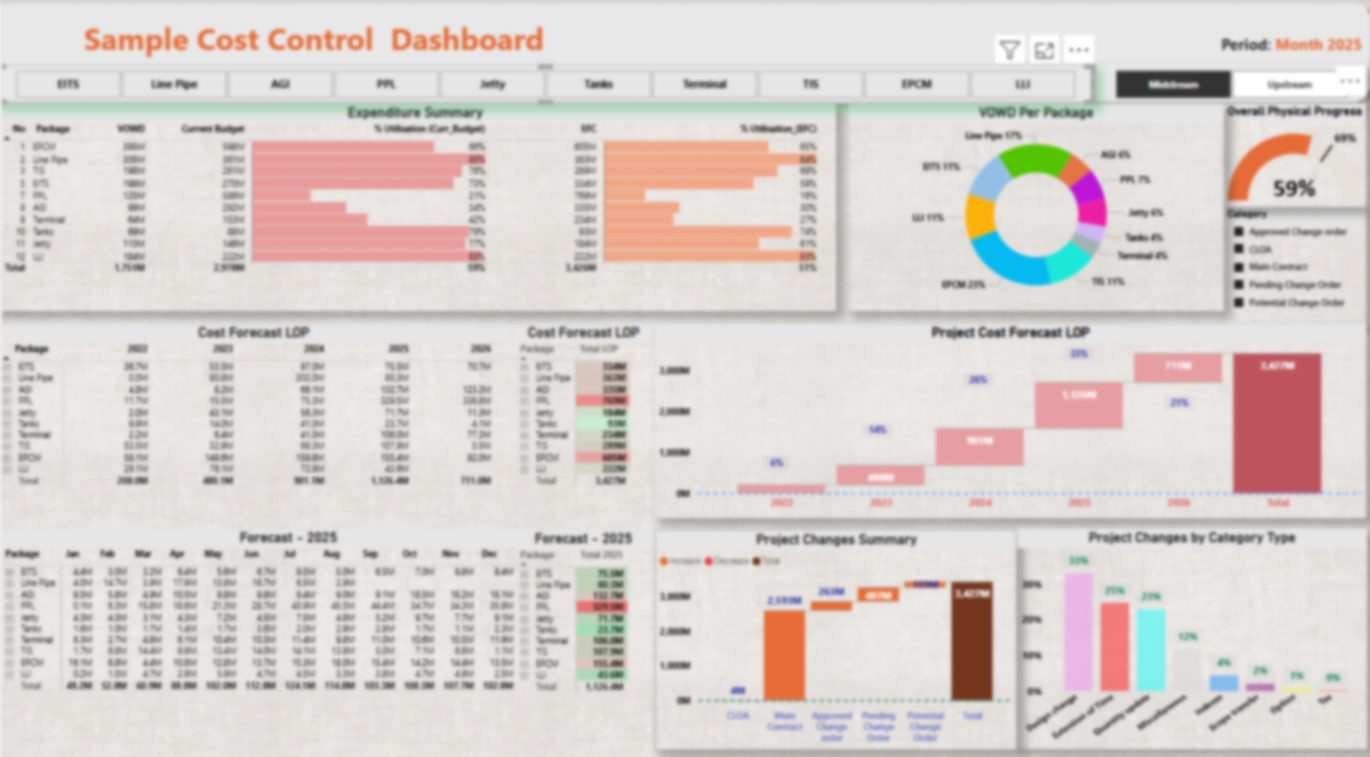
Power BI Cost Control Dashboard for Capital Projects
Year
2025
Industry
Finance
Client Context
A large-scale capital project required strict financial oversight across multiple cost centers. Project controls were previously managed in spreadsheets, making it difficult to consolidate budgets, forecasts, change orders, and work progress into a single version of truth.
Key data sources included:
- Excel-based Cost Reports capturing budgets, forecasts, and change orders.
- Work-in-progress and Value of Work Done (VOWD) tracking.
- Power BI dashboard consolidating spend, variances, forecasts, and progress.
The Problem
- Manual Consolidation — cost teams spent days compiling spreadsheets into monthly reports.
- No Real-Time Forecasting — Estimate at Completion (EFC) was reactive and not tied to change orders dynamically.
- Limited Visibility — stakeholders lacked a central dashboard for spend, commitments, and forecasts.
- Disconnected Progress Metrics — cost progress was not easily compared against physical work progress, creating blind spots.
Key Findings
- EFC Growth Identified — forecasts exceeded original budget by approximately 10% due to change orders and scope adjustments.
- High Variance Detection — certain areas showed significant gaps between budget and forecast.
- Work vs. Cost Misalignment — dashboards revealed instances where cost progress was higher than physical progress.
- Change Order Impact — highlighted the financial impact of late or frequent changes.
- Forecast Accuracy Improved — real-time adjustments reduced reporting lag and increased confidence.
ROPA’s Solution
- EFC & Change Orders Integration: live updates of Estimate at Completion as change orders were approved.
- Cost Control Dashboard: consolidated budgets, forecasts, actuals, and commitments in one view.
- VOWD vs. Forecast Tracking: aligned cost progress against actual physical progress.
- Monthly Trend Analysis: actual spend vs. budget across reporting periods.
- Portfolio Summary: high-level CAPEX tracking with contingency and variances clearly visible.
Business Impact & Actionable Steps
- Improved Forecast Reliability — EFC automatically updated with each new change order.
- Early Risk Detection — dashboards flagged high-variance areas for corrective action.
- Aligned Progress Tracking — linking cost progress with physical progress improved accountability.
- Faster Monthly Reporting — consolidation reduced from days to hours.
- Informed Decision-Making — real-time CAPEX visibility improved stakeholder confidence.
Why This Matters
This project highlights how ROPA Advisory transforms cost control into a proactive management tool. By integrating EFC, change orders, VOWD, and forecast tracking into Power BI, leadership achieved clarity, speed, and control over project spend.
At ROPA Advisory, we empower cost control teams with the tools to see risks early, act decisively, and deliver capital projects on budget.