Power BI Dashboard for Gaming & Revenue Insights
Client Context
A gaming operator managing multiple products across diverse markets faced challenges in consolidating collections, payouts, winnings, and revenue into a single view. Financial metrics like Gross Gaming Revenue (GGR), Net Gaming Revenue (NGR), and Net Profit were tracked in spreadsheets, leading to slow reporting and limited decision-making visibility.
Key data sources included:
- Excel reports tracking collections, payouts, winnings, and GGR by product.
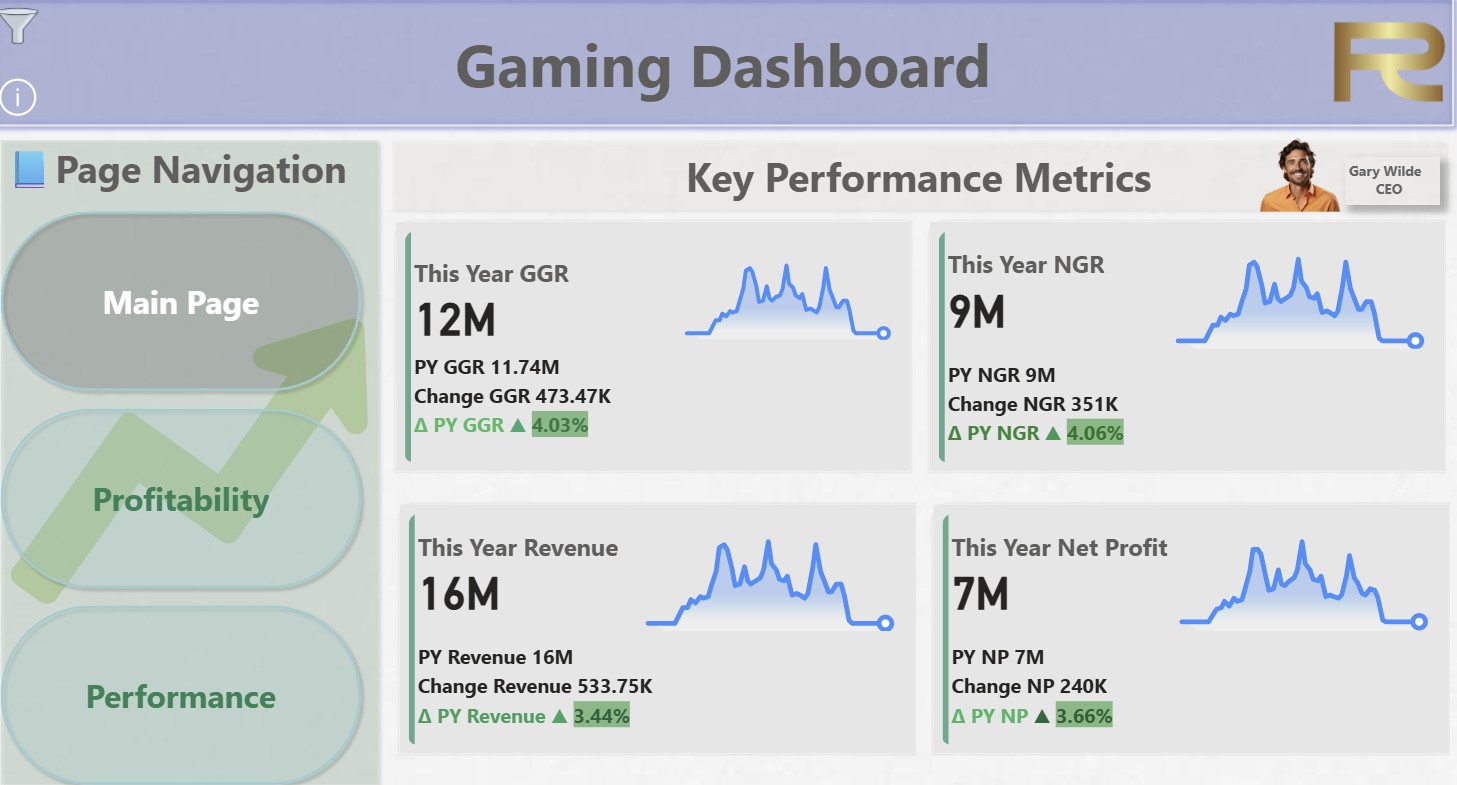
- Power BI dashboard combining revenue, profit, and payout metrics across games.
The Problem
- Fragmented Reporting — each product was tracked in silos.
- Delayed Profitability Insights — Net Profit and NGR were manually calculated, creating lags.
- No Holistic View — management couldn’t easily see GGR, payouts, and profitability across products in one place.
- Lack of Comparative Analysis — product performance couldn’t be benchmarked effectively to guide investments.
Key Findings
- GGR Volatility — significant fluctuations observed across months, requiring tighter monitoring.
- Profitability Drivers — certain products contributed disproportionately to NGR and Net Profit.
- Payout Ratios — some products showed high payout-to-collection ratios, highlighting potential risks.
- Revenue Mix Shift — newer games gained share over traditional ones.
- Efficiency Gaps — reconciliation revealed inconsistencies between winnings and collections.
ROPA’s Solution
- Revenue & Profit KPIs: GGR, NGR, Net Profit, and Total Winnings tracked in real time.
- Collections vs. Payouts: automated variance analysis across products.
- Historical Trends: month-on-month comparisons of revenue and winnings.
- Product Performance: drill-down by game type for profitability benchmarking.
- Executive Summary View: consolidated profit & loss snapshot for quick decision-making.
Business Impact & Actionable Steps
- Refocused marketing spend on high-margin products.
- Optimized payout structures by monitoring payout ratios per product.
- Aligned strategy with performance by scaling games with strong NGR trends.
- Reduced reporting time from days to near real-time through automation.
- Improved investor reporting with transparent profitability dashboards.
Why This Matters
This engagement demonstrates how ROPA Advisory empowers gaming operators with financial clarity. By transforming fragmented Excel sheets into a unified Power BI dashboard, we provided executives with instant visibility into revenue, profit, and payouts — enabling faster, data-driven decisions in a competitive sector.
At ROPA Advisory, we help gaming operators move from fragmented reports to real-time profitability insights, ensuring every decision is backed by data.